🤖 Kevin Warsh Just Rewired the Fed ⚡
New chair, new tone, new dot plot. Rates are on hold, but a hike is now more likely than a cut.
GM, Spotters. This is BotSpot, brought to you by the team behind Lumiwealth. Each week we walk through the market stories worth knowing about, with context, color, and a clear head.
- 🪑 Kevin Warsh ran his first FOMC meeting this week. It did not go quietly.
- 📈 Rates held steady, but the dot plot shifted. More officials now see a hike coming than a cut.
- 🎲 Kalshi traders are now pricing greater than 50% odds of a hike before year end. Not a typo.
- 📉 Treasury yields actually slipped after the meeting. Markets are still chewing on what Warsh meant.
- 🪙 The Fed also floated new rules on stablecoin issuers. Crypto nerds, your section is at the bottom.
Warsh Walked In and Flipped the Table

For eight years, Jerome Powell talked to the market constantly, almost like a group chat that never went on mute. Kevin Warsh just put the group chat on Do Not Disturb.
Warsh held his first FOMC meeting on June 16 and 17. Rates stayed where they were. But the signal underneath the hold was anything but boring.
4.2% — Inflation in May 2026. A three-year high. This is the number that turned a rate hike from a joke into a real possibility.
The dot plot, which is just a chart showing where Fed officials think rates are going, shifted hard. More officials penciled in a hike for 2026 than a cut. Goldman Sachs pushed its first cut forecast all the way to June 2027.
Warsh also formed new task forces, changed how the Fed communicates, and made clear he is not Powell 2.0. He is a different model entirely. Think operating system upgrade, not a patch.
"It wouldn't come as a surprise if he keeps the public at arm's length."
— Daily Upside, June 15, 2026
 Warsh signaled fewer press conferences. Wall Street is still processing.
Here is the part that matters for you. The market spent most of 2025 waiting for cuts. Cuts are now the base case for 2027, not 2026. That changes how you think about the next 12 months.
Longer rates staying higher means bond prices stay under pressure. Growth stocks, which borrow cheaply to fund big dreams, face a tougher road. SPY holders are fine for now, but the rate-sensitive corners of the market are sweating.
👉 The news is Warsh held rates but flipped the dot plot toward hikes. The takeaway for you is the market's cut-chasing playbook from 2025 just got shelved, and higher-for-longer just got a new landlord.
- Watch the July FOMC: CME FedWatch put July hold odds at 92%. That number will move fast if inflation prints hot again.
- Watch the dot plot details: how many officials penciled in two hikes vs. one is the number that matters most.
- Watch Warsh's communication style: fewer press conferences means less Fed hand-holding and potentially jumpier data days.
- Watch TLT and rate-sensitive ETFs: if the hike narrative firms up, bond prices face more pressure.
- Watch Kalshi odds weekly: prediction markets moved to greater than 50% hike probability. Spot says that is the number to track.
Analyze rate scenarios on BotSpot
The TLT Put Spread: Renting Insurance on Rates
How to think about it
When the Fed signals it might hike instead of cut, bonds tend to fall. TLT is the big ETF that tracks 20-plus-year Treasury bonds. When rates go up, TLT goes down. That relationship is pretty reliable.
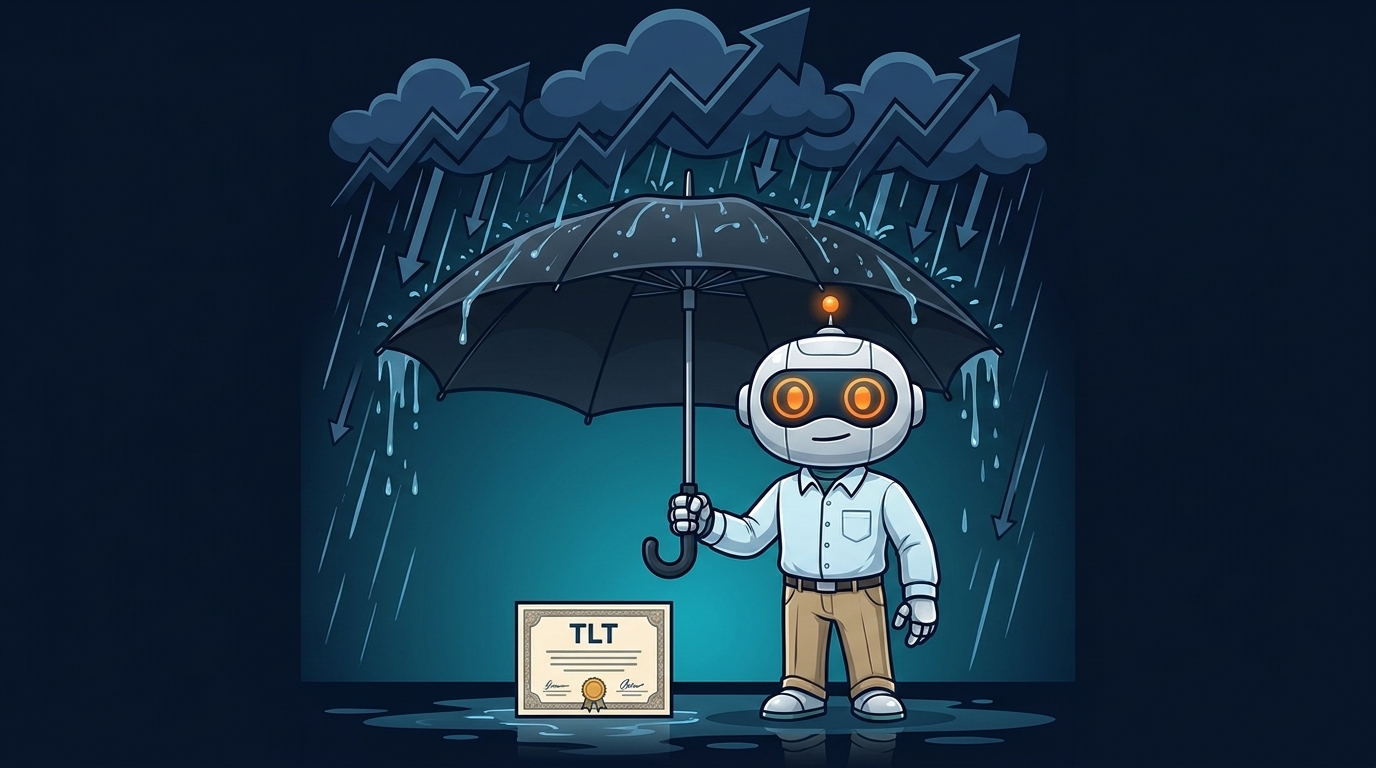
A put spread on TLT is a way to think through what happens if rates keep climbing. You buy the right to sell TLT at a lower price, and you sell the right at an even lower price to reduce the cost. It is a defined-risk structure, meaning you know your max loss before you put anything on.
Asset: TLT (iShares 20+ Year Treasury ETF) (OPTIONS / FIXED INCOME ETF)
If the Warsh Fed follows through on higher-for-longer, long-duration Treasury bonds face continued price pressure. A put spread on TLT is an example of a defined-risk structure that profits if TLT declines, with a capped cost.
Mechanics
| Field | Value |
|---|---|
| INSTRUMENT | TLT put spread (buy a put, sell a lower-strike put, same expiry) |
| STRUCTURE | Debit spread. You pay a net premium upfront and max loss is that premium. |
| THESIS DRIVER | Fed dot plot shift toward hikes puts long-duration bond prices under pressure. |
| KEY RISK | If inflation cools fast or the economy weakens, the Fed pivots and TLT rallies, making the spread expire worthless. |
| WATCH FOR | July CPI print and Warsh's next public comments as the catalysts that move this thesis. |
Why it matters: The news is the Fed's new dot plot leans toward hikes, not cuts. The takeaway for you is that the structure of a TLT put spread is worth understanding as an educational example of how traders position for a rising-rate environment with defined, limited risk.
For educational purposes only. Not investment advice. Always do your own research.
👉 The news is defined-risk options structures exist for traders who want to study rising-rate scenarios. The takeaway is the mechanics are worth understanding before the next CPI print forces a decision.
The Boring Bond Rotation That Quietly Does Its Job
How it works
The TLT mean-reversion strategy watches when Treasury bond prices fall far below their recent average and buys them on the assumption they snap back. It is not glamorous. It is the financial equivalent of buying tomatoes when the grocery store marks them down.

The trade-off is real. Mean reversion works until the thing stops reverting. In a sustained rate-hike cycle, bond prices can stay low for a long time, and the strategy needs a calm stomach and a clear exit rule.
Strategy: TLT Mean Reversion (RSI-Based Entry) Category: MEAN-REVERSION / TREASURIES This strategy buys TLT when a short-term momentum indicator like RSI drops into oversold territory, signaling that the recent selloff may have gone too far. It exits when price recovers toward its recent average. The natural trade-off is that it works well in choppy, range-bound rate environments but can struggle when yields trend strongly in one direction. Running your own backtest across different rate regimes is the fastest way to see where the edge shows up and where it breaks down. Browse on the BotSpot Marketplace Build it on BotSpot Educational only. Backtest the strategy yourself on BotSpot to draw your own conclusions.
👉 Don't take our word for it. Run the backtest yourself and see where mean reversion holds up and where it gets steamrolled by a hiking cycle.
Spot Checks the Vibe
 Mood: Neutral (VIX 16.8)
VIX at 16.8 puts us squarely in neutral territory. The market heard 'possible hikes' from a brand-new Fed chair and shrugged. Either everyone is very calm or nobody has fully processed it yet.
Mood: Neutral (VIX 16.8)
VIX at 16.8 puts us squarely in neutral territory. The market heard 'possible hikes' from a brand-new Fed chair and shrugged. Either everyone is very calm or nobody has fully processed it yet.
The Market Right Now
Quick Hits Before You Go
- Warsh's first meeting was unanimous. No dissents, no drama, just a clean 12-0 hold. The drama was all in the dot plot.
- Kalshi traders see hike odds above 50%. Prediction markets moved faster than the press conference. Spot is taking notes.
- Goldman pushed cuts to June 2027. They had December 2026, then March 2027, now June 2027. At this rate, 2028.
- Treasury yields slipped after the meeting. The market heard 'possible hikes' and bought bonds anyway. Traders gonna trade.
- Jobless claims fell to 226,000. Labor market is still holding up, which gives the Fed cover to stay tough on rates.
- The Fed wants stablecoin ID rules. New proposal would require payment stablecoin issuers to verify who their customers are. Crypto, meet compliance.
- Powell is now chair pro tempore. He stays until Warsh is officially sworn in. Lame duck season, but with a press conference.
The BotSpot Team
Issue 8 · Jun 18, 2026