📉 Bonds Just Dialed 1999. Nobody Budged.
The 10-year Treasury yield crossed 5.3% and the 30-year hit 5.68%. We haven't seen numbers like this since the turn of the century. Spot is wide-eyed.
GM, Spotters. This is BotSpot, brought to you by the team behind Lumiwealth. Each week we walk through the market stories worth knowing about, with context, color, and a clear head.
- 📈 The 10-year Treasury yield crossed 5.3%, a 24-year high. The bond market is not okay.
- 💵 The dollar hit a 16-month high. Strong dollar, rising yields, nowhere to hide.
- 🤖 AI stocks tried to rally. The bond market checked them at the door.
- 🏦 The Fed finalized new stress test rules. Less drama for big banks, maybe.
- ⏸️ The Fed is on hold, possibly for a while. Spot says patience is a strategy.
The Bond Market Called 1999 and Got an Answer

The 10-year Treasury yield just crossed 5.3%. The 30-year hit 5.68%. The last time the bond market looked like this, people were still buying CDs at Circuit City.
This is not a blip. Yields have been climbing for weeks, and this week they broke through levels that even veteran traders had to Google to confirm they were real.
5.68% — The 30-year Treasury yield as of Oct 1, 2026. Last seen at this level in the year 2000, when dial-up internet was premium service.
Here is the short version of why this matters. When bond yields go up, it costs more to borrow money. That slows businesses, cools the housing market, and makes stocks look less attractive by comparison.
The dollar also hit a 16-month high this week. A strong dollar sounds patriotic but it squeezes US companies that sell overseas, because their products get more expensive abroad.
"The bond market is not panicking. It is simply repricing everything else."
— Spot, staring at the yield curve at 2am
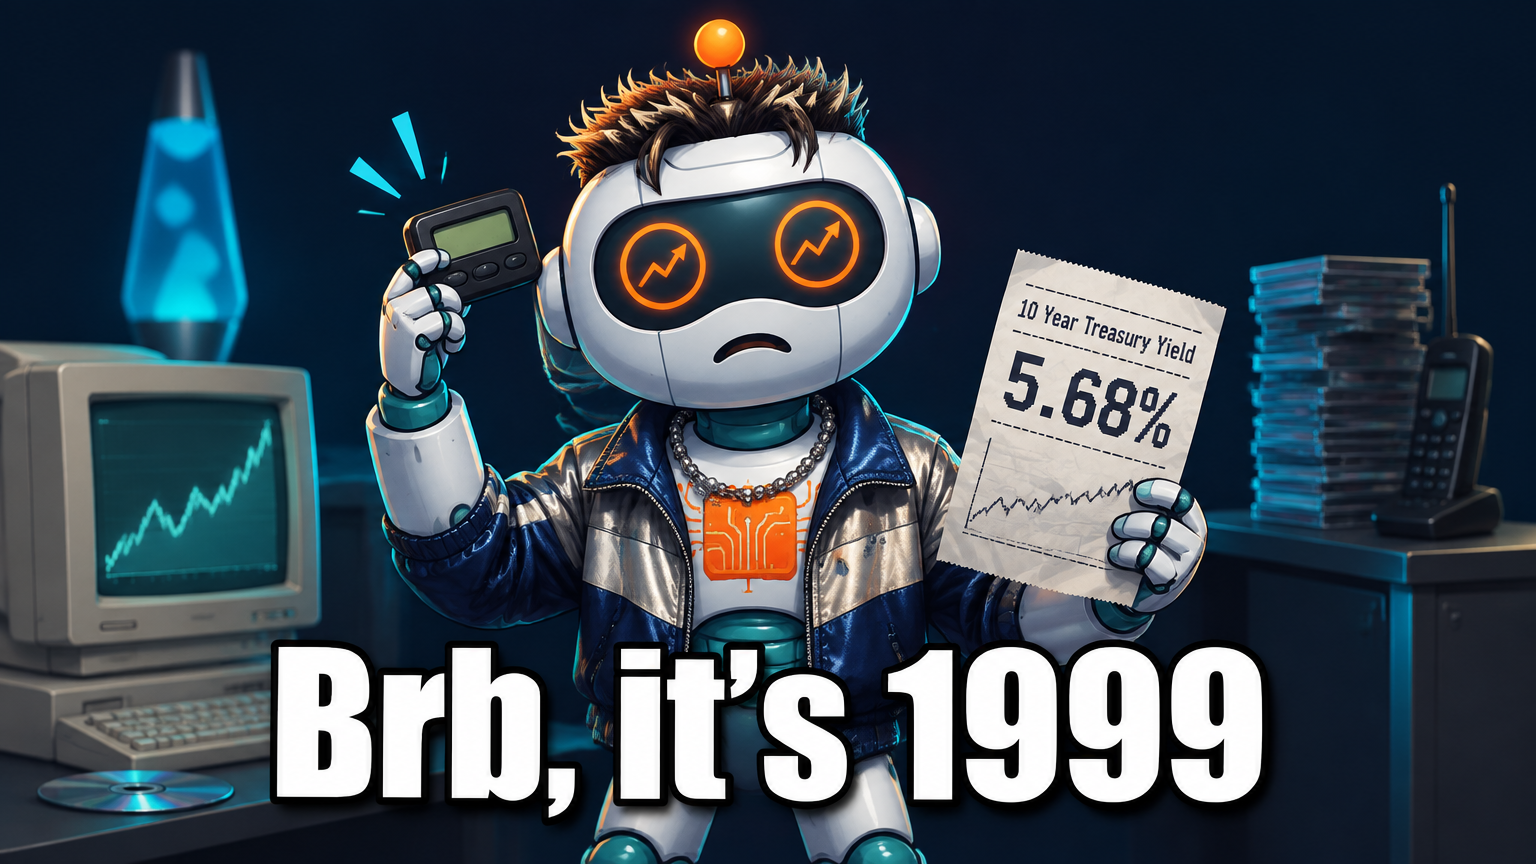 The bond market left a message. You probably don't want to hear it.
What stopped the AI stock rally in its tracks this week was not bad earnings. It was the bond market. Nasdaq futures trimmed gains because investors kept one eye on the yield chart and one hand on the exit.
There is also a twist worth knowing: the classic 60-40 portfolio (60% stocks, 40% bonds) is finally doing what it was designed to do. For the first time in years, bonds are providing real income again. Some money managers are calling it a comeback.
👉 The news is Treasury yields just hit 24-year highs and the dollar is at a 16-month peak. The takeaway for you is that rising yields reprice everything from stocks to mortgages, and higher rates for longer is now the working assumption.

- Watch the 10-year yield at 5.5%: that has historically been the level where equity risk premiums flip negative.
- Watch the dollar index (DXY) above 102: multinational earnings get squeezed, which shows up in Q3 reports starting in two weeks.
- Watch the Fed's next meeting language: 'higher for longer' is now consensus, but any pivot hint would move markets hard.
- Watch the 60-40 portfolio comeback story: if bonds are genuinely providing income again, allocation models shift and that moves fund flows.
The Treasury Yield Spike Has a Two-Sided Trade Worth Studying
How to think about it
When yields spike like this, two things tend to happen at once. Long-duration bond ETFs like TLT get crushed because their prices move opposite to yields. But short-duration and floating-rate instruments hold up, or even benefit. The spread between those two outcomes is the interesting part.

A pairs-style thought experiment here: what if you studied the historical behavior of going short TLT (the long-bond ETF) while holding a short-duration bond fund or cash equivalent? This is not a recommendation. It is a structure worth understanding before you walk into a rate environment like this one unprepared.
Asset: TLT vs. Short-Duration Bond ETF (e.g. SHV or SGOV) (Fixed Income / ETF Pairs)
In a rising-yield environment, long-duration bonds lose value faster than short-duration bonds. Studying the spread between them helps frame how much duration risk is sitting in a standard portfolio.
Mechanics
| Field | Value |
|---|---|
| INSTRUMENT | TLT (20+ yr Treasury ETF) vs. SHV or SGOV (short-duration) |
| STRUCTURE | Pairs study: observe the divergence in price when yields move |
| THESIS DRIVER | Duration risk: longer bonds fall harder when rates rise |
| KEY RISK | Yield reversal: if the Fed signals a pivot, TLT snaps back fast |
| WATCH FOR | 10-year at 5.5%, Fed language shift, or a surprise CPI print |
Why it matters: The news is that long-duration bonds are pricing in rates staying high for years. The takeaway for you is that understanding how duration affects bond ETF prices is one of the most practical things any SPY-and-options trader can study right now.
For educational purposes only. Not investment advice. Always do your own research.
👉 The news is duration risk is not theoretical right now. The takeaway is that knowing how much duration is in your bond holdings is worth a 10-minute research session before Q3 earnings hit.
The Boring Strategy That Rate Spikes Cannot Kill
How it works
The Treasury-bill rotation strategy is about as unsexy as it gets. When short-term T-bill yields are high, you park cash there instead of sitting in a money market or bond fund. When yields drop, you rotate into equities. The idea is simple: always be earning something while you wait.

With 3-month T-bill yields above 5%, the opportunity cost of being fully in stocks has never been higher in a generation. This strategy asks a simple question: is the extra risk of equities worth it right now versus locking in a real yield? You run the backtest. You decide.
Strategy: T-Bill Rotation: Cash vs. Equities Timing Category: DEFENSIVE / RATE-SENSITIVE This strategy compares holding short-term T-bills when yields are above a set threshold versus rotating into an equity ETF when yields fall below it. The trade-off is simple: you give up some upside in strong bull runs in exchange for real income and reduced drawdown during rate-driven selloffs. It works best as a framework for thinking about opportunity cost, not as a market-timing crystal ball. Browse on the BotSpot Marketplace Build it on BotSpot Educational only. Backtest the strategy yourself on BotSpot to draw your own conclusions.
👉 Don't take our word for it. Run the backtest yourself and see how the rotation behaves in a rate environment like the one we're in right now.
Spot Checks the Vibes
 Mood: Neutral (VIX 16.3)
VIX at 16.3 puts us squarely in Neutral territory. The market is not running for the exits, but it is not exactly popping champagne either. Yields are scary, the Fed is frozen, and the AI trade is treading water. Cautious calm, not confident calm.
Mood: Neutral (VIX 16.3)
VIX at 16.3 puts us squarely in Neutral territory. The market is not running for the exits, but it is not exactly popping champagne either. Yields are scary, the Fed is frozen, and the AI trade is treading water. Cautious calm, not confident calm.
Every Bond Investor Right Now
Bite-Sized Cookies for the Road
- The 30-year yield hit 5.68%. The last time that happened, people were still deciding whether to buy a DVD player or a LaserDisc.
- The dollar hit a 16-month high. Strong dollar, shrinking overseas profits, very busy CFOs.
- The Fed is on hold. Maybe for a while. Or as the Fed calls it, data-dependent patience, which is the same thing with better posture.
- The AI rally hit a wall. Nasdaq futures rose, then did not. Bonds said no.
- The Fed stress tests got a makeover. More transparency, less drama, same big banks sweating October.
- France's borrowing spread hit a 14-year wide. When the bond selloff crosses the Atlantic, it is not a US problem anymore.
- Money managers want you to try bonds again. 60-40 is back, they say, with the energy of someone who just found their ex on LinkedIn.
The BotSpot Team
Issue 23 · Oct 1, 2026