💥 OpenAI's $20B Oops (And Why TSMC Didn't Blink)
OpenAI told investors one number. The real number was $20 billion smaller. Global AI stocks flinched. The chip kings kept printing records anyway.
GM, Spotters. This is BotSpot, brought to you by the team behind Lumiwealth. Each week we unpack the market stories worth knowing, with context, a clear head, and Spot doing his best to keep up.
- 💥 OpenAI quietly revised its revenue estimate down by $20 billion. Markets noticed.
- 🏭 TSMC just posted $46.7B in quarterly revenue, a 50% jump, while the AI software crowd sweated.
- 🌊 The IMF called AI a slow-moving tsunami that could wipe out 40% of jobs. Cool Monday morning.
- 🫖 Starbucks explored buying Chipotle. Starbucks denied it. Chipotle said nothing. Classic.
- 📉 Nasdaq futures fell hard as the global AI selloff intensified. Spot is watching.
OpenAI's $20B Oops (And Why TSMC Didn't Blink)

OpenAI told investors its annualized revenue hit roughly $70 billion. Then came the correction: it was actually closer to $50 billion.
That is a $20 billion gap. In public markets, that kind of revision would trigger an SEC inquiry. In private markets, it triggered a semiconductor selloff.
$20,000,000,000 — The gap between what OpenAI told investors and the actual number. That is twenty billion dollars of oops.
The fallout was fast. Oracle dropped more than 6% in one session. An Nvidia-backed cloud startup called Firmus quietly shelved its IPO.
The Philadelphia Semiconductor Index fell 7% from the prior Wednesday's close. TSMC and ASML got dragged down too, falling 5.5% and 3.5% respectively.
"TSMC just posted $46.7 billion in a single quarter. That is a 50% year-over-year jump. The AI demand signal is not softening."
— BotSpot, reading the actual numbers
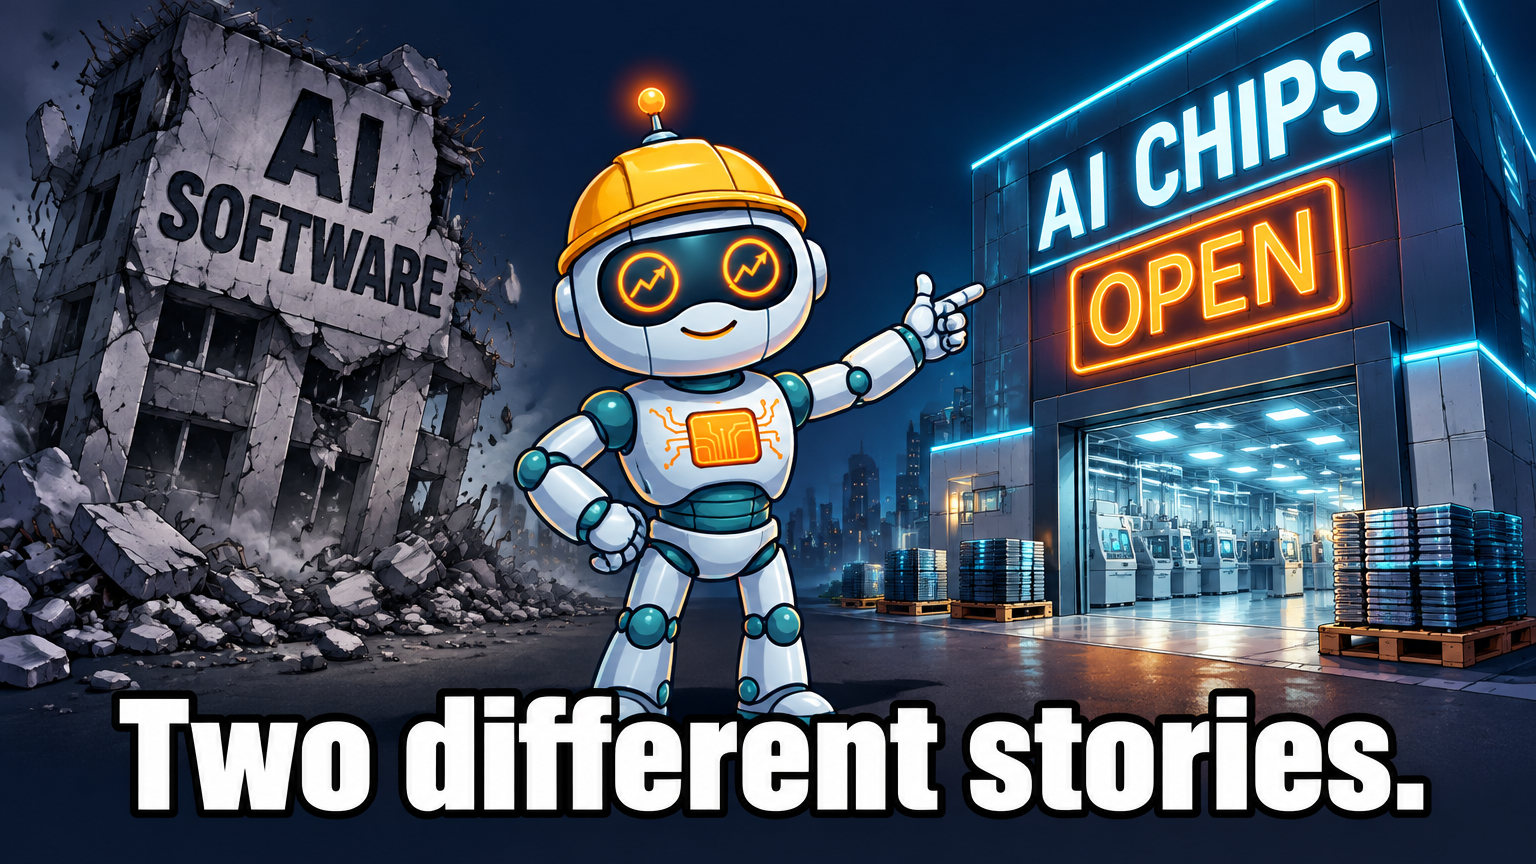 Hardware is eating software's lunch. Or at least its quarterly report.
Here is the split that matters. Open-weight AI models are cutting the cost of software tokens roughly in half since May. But the cost of renting a GPU keeps climbing because demand for compute still outstrips supply.
Translation: the AI software race is getting cheaper and more crowded. The hardware side is still a seller's market. Spot says these two trends are moving in opposite directions, and that gap is the whole story this week.
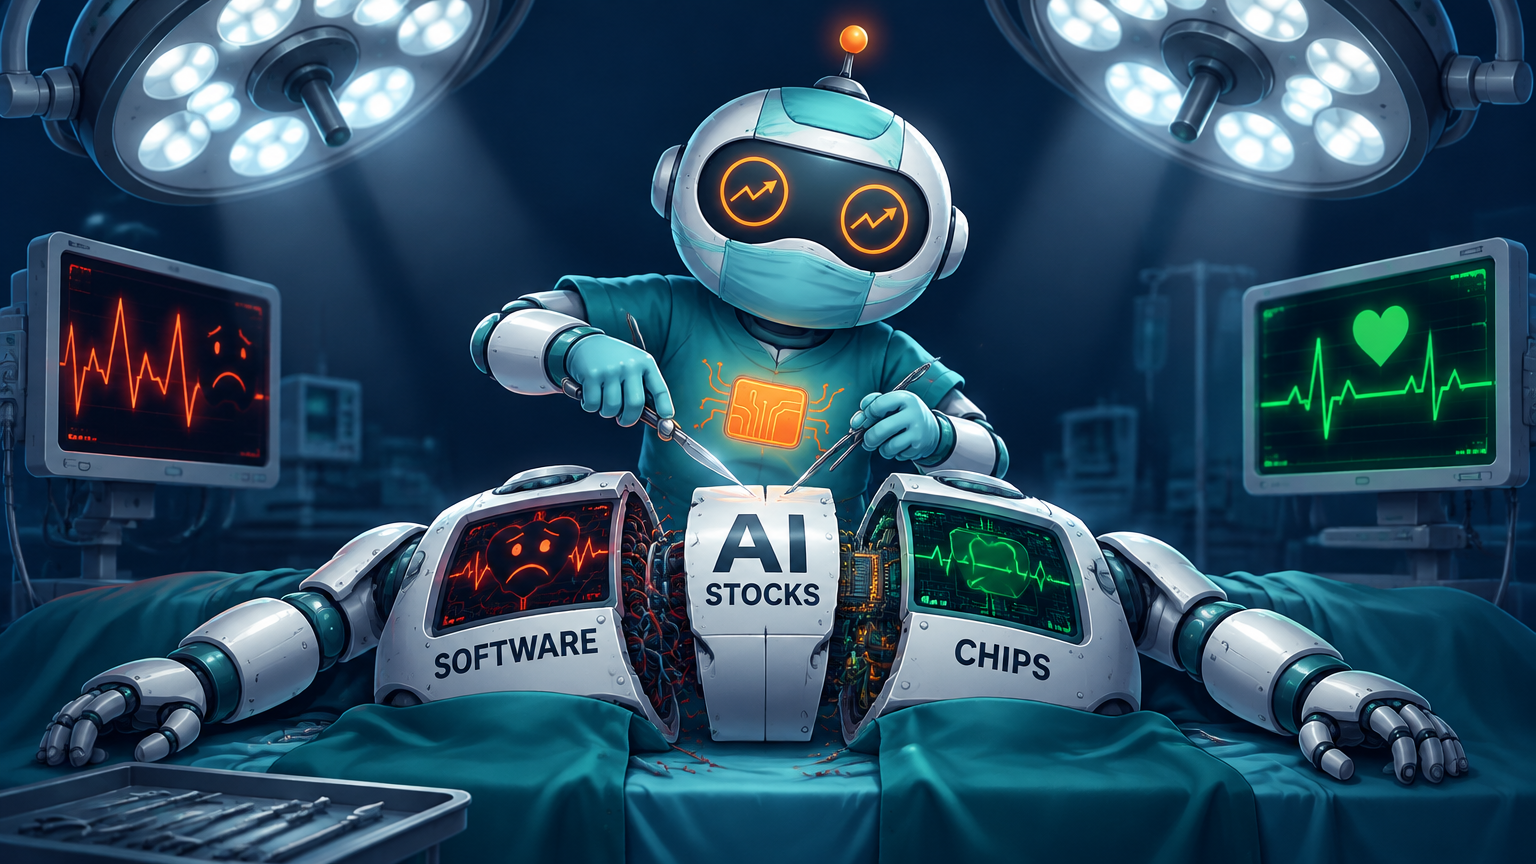
👉 The news is OpenAI's revenue revision rattled AI stocks across the board. The takeaway for you is that the selloff hit hardware and software equally, even though their fundamentals are pointing in opposite directions right now.
- Watch TSMC's full earnings call for guidance: if demand signals hold, the hardware-vs-software split widens.
- Watch ASML's pricing power: a planned 10% price hike on lithography machines tells you who still has leverage.
- Watch the Philadelphia Semiconductor Index: a 7% drop on software news is an overreaction worth studying.
- Watch QQQ's composition: it holds both software and hardware AI names, so the index masks the internal split.
- Watch OpenAI's IPO timeline: a $20B credibility gap before going public is not a small footnote.
Hardware vs. Software: The AI Pair Worth Studying
Thinking through it
The OpenAI revision cracked AI software stocks and dragged chip makers down with them. But TSMC just printed a record quarter on the same day. That kind of disconnect is what traders call a divergence, and divergences sometimes set up interesting structures to study.

The thought experiment here is a pairs-style observation. When two correlated assets diverge because of a single news event, do they eventually snap back together, or does the gap widen? That is an educational question worth exploring with real data.
Asset: SOXX vs. IGV (Semiconductor ETF vs. Software ETF) (ETF / Equities)
TSMC's record revenue and ASML's pricing power suggest chip demand is structurally different from AI software demand right now. The question is whether the market will eventually price these two groups differently, or whether they keep moving together on AI headlines.
Mechanics
| Field | Value |
|---|---|
| INSTRUMENT | SOXX (iShares Semiconductor ETF) vs. IGV (iShares Expanded Tech-Software ETF) |
| STRUCTURE | Observational pairs study: track relative performance between chip hardware exposure and AI software exposure |
| THESIS DRIVER | GPU compute demand still outstrips supply; AI software token costs are falling as open models compete |
| KEY RISK | A single macro shock like tariffs, a rate hike, or a geopolitical event can close any divergence instantly |
| WATCH FOR | TSMC full earnings guidance, ASML price hike confirmation, OpenAI IPO timeline clarity |
Why it matters: The news is that a software revenue miss dragged hardware stocks down with it. The takeaway for you is that studying how correlated assets diverge and recover is a foundational skill for any structured-thinking trader.
For educational purposes only. Not investment advice. Always do your own research.
👉 The news is chip stocks and software stocks got sold together. The takeaway is they may not belong in the same basket anymore.
The Boring Strategy That Loves Selloffs
How it works
When a sector sells off because of headline risk rather than a real fundamental breakdown, some traders use a covered call wheel to collect income while they wait for the smoke to clear. You own shares of an ETF, sell a covered call above the current price, and collect the premium whether the stock moves or not.

The trade-off is straightforward: you cap your upside at the strike price you sold, but you keep the premium no matter what. In a sideways or slowly recovering market after a news-driven drop, that premium can add up over multiple cycles.
Strategy: Covered Call Wheel on SOXX Category: INCOME / OPTIONS The covered call wheel sells a call option above the current price each week or month on a position you already hold, collecting the option premium as income. After a news-driven selloff that does not change the underlying demand picture, implied volatility often spikes, which makes the premiums temporarily fatter. The strategy does not protect you from a real fundamental breakdown, and it caps your gains if the stock recovers fast. The interesting question is how it performs specifically during post-selloff recovery windows in high-volatility semiconductor names. Browse on the BotSpot Marketplace Build it on BotSpot Educational only. Backtest the strategy yourself on BotSpot to draw your own conclusions.
👉 Don't take our word for it. Run the backtest yourself and see what the premiums look like in the weeks after a sentiment-driven selloff.
Spot Checks the Vibe
 Mood: Neutral (VIX 15.5)
VIX at 15.5 means the market is not panicking, but it is not exactly throwing a party either. After a week of AI headline risk and a global chip selloff, cautiously unbothered is probably the honest description.
Mood: Neutral (VIX 15.5)
VIX at 15.5 means the market is not panicking, but it is not exactly throwing a party either. After a week of AI headline risk and a global chip selloff, cautiously unbothered is probably the honest description.
The Revenue Number in the Room
Five More Things Worth Knowing
- TSMC printed $46.7 billion in one quarter. That is a 50% year-over-year jump and another record, while the software side of AI had a very different week.
- The IMF called AI a slow-moving tsunami. It forecasts 40% of all jobs will be augmented, downgraded, or eliminated, with 60% of jobs in advanced economies sitting in that bucket. Casual Monday morning announcement.
- CFOs are spending half their day checking AI outputs. A Datarails survey found 96% of finance leaders spend at least 10% of their day verifying AI work, and a third spend up to half the day doing it. AI was supposed to save time. Results vary.
- Starbucks explored buying Chipotle. Then denied it. The rumor alone reshuffled two CFO succession plans and delayed at least one long-overdue retirement by nearly a year.
- Korean stocks are in freefall. Skepticism about how long the semiconductor boom can last has sent Korean markets lower, and sentiment there tends to be a leading indicator for the global chip trade.
- LLM token costs have roughly halved since May. Meanwhile, GPU rental prices keep climbing. Open-weight models are winning the software price war while the hardware side is still a seller's market.
- GLP-1 users are raiding retirement accounts. More than 14% of people on weight-loss drugs have already pulled money from retirement savings to pay for them. Healthcare costs and retirement planning just became the same conversation.
The BotSpot Team
Issue 25 · Oct 13, 2026