🌩️ 5% Yields Are Back. The Bond Market Is Not Okay.
The 10-year Treasury just hit its highest level since 2007. Here is what that actually means for your portfolio.
GM, Spotters. This is BotSpot, brought to you by the team behind Lumiwealth. Each week we break down the market stories worth knowing, keep the jargon out, and let Spot do the heavy lifting.
- 📈 The 10-year Treasury yield cracked 5.1%. Highest since 2007. Stocks did not love it.
- 🌩️ A former Dallas Fed chief says the bond market is overpricing rate hikes. Bold take.
- 💵 The dollar got a lift from hawkish Fed expectations. Gold got squished.
- 🏠 U.S. household net worth hit $181.6 trillion in Q3. Real estate down a bit. Stocks way up.
- 🤖 Spot is watching the bond storm closely. He has prepared a very serious chart. It is mostly red.
A Perfect Storm Is Raging in the Bond Market

The 10-year Treasury yield just hit 5.1%. That is the highest level since 2007. George W. Bush was president. The iPhone did not exist yet.
Stocks fell hard. The bond market posted its biggest single-day move in over a year. Oil kept climbing. Everything that was supposed to calm down this fall did the opposite.
5.1% — The 10-year Treasury yield this week. Not seen since 2007. The kind of number that makes bond traders call their therapists.
Here is the simple version of what happened. When the Fed signals more rate hikes, bond prices fall and yields rise. Investors demand more return for holding long-term debt. It is a math thing.
But this week was not a slow grind. It was a spike. The WSJ called it a perfect storm: rising oil prices pushed inflation fears back up, the Fed held firm on its hawkish tone, and the bond market hit the panic button.
"The bond market is pricing in too many Fed hikes, said a former Dallas Fed president, with the energy of someone who just watched a fender-bender turn into a ten-car pileup."
— via MarketWatch
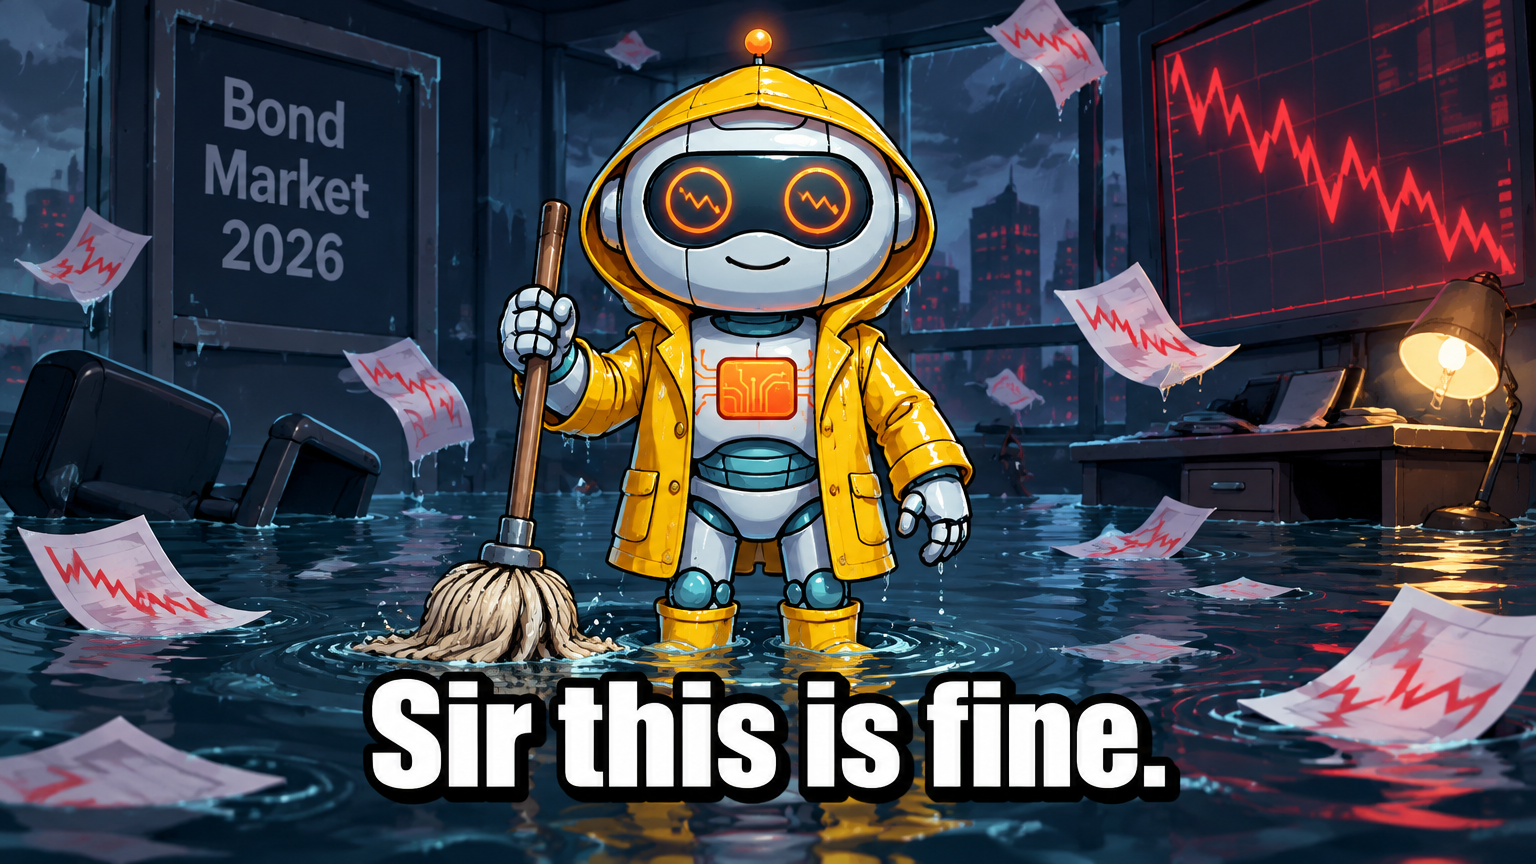 10-year yields at 5.1%. The mop is not helping.
Why does this matter if you mostly hold SPY? When government bond yields jump this high, stocks look relatively less attractive by comparison. Investors can earn 5% just by holding government debt.
That comparison puts pressure on stock valuations across the board. The S&P 500 dropped on the news. It was not a crash. But it was a reminder that bonds and stocks are in a tug-of-war right now.
👉 The news is the 10-year yield hit a 19-year high. The takeaway for you is that high yields make the math harder for stocks, especially growth stocks, and easier for cash-like alternatives.
- Watch the 5% level on the 10-year. If it holds above 5% for more than a week, the pressure on equities tends to build.
- Watch oil. Oil is the inflation fuel driving this bond storm. If oil cools, yields may follow.
- Watch the Fed's next statement. One former Fed official already says the market is overpricing hikes. If the Fed signals a pause, bonds could bounce fast.
- Watch gold. It got hit this week because high yields make gold less attractive. A reversal in yields would flip that script.

When Yields Spike, TLT Gets Interesting
Thinking through it
When yields spike hard and fast, they often overshoot. Bond prices fall, TLT (the long-term Treasury ETF) falls with them, and eventually the market starts to ask: did we go too far? That question is the setup for a mean-reversion thought experiment.

TLT tracks 20-plus year Treasury bonds. When yields rise, TLT falls in price (that is just how bonds work). When yields eventually fall back down, TLT tends to recover. The question a sharp trader might study: is this spike a turning point or just the beginning?
Asset: TLT (iShares 20+ Year Treasury Bond ETF) (Fixed Income ETF)
Long-term yields spiked to a 19-year high this week. History suggests these moves sometimes overshoot. A mean-reversion thesis on TLT asks whether the selloff has gone too far, too fast.
Mechanics
| Field | Value |
|---|---|
| INSTRUMENT | TLT (iShares 20+ Year Treasury Bond ETF) |
| STRUCTURE | Long shares or long call options if studying a rebound scenario |
| THESIS DRIVER | 10-year yields at 5.1% (highest since 2007) may represent an overshoot that corrects if the Fed signals a pause |
| KEY RISK | If yields keep rising, TLT keeps falling. The overshoot could get more overshooty. |
| WATCH FOR | Fed language softening, oil prices cooling, or CPI coming in below expectations |
Why it matters: The news is that TLT is near multi-year lows as yields hit levels not seen since 2007. The takeaway for you is that understanding how bond ETFs behave during yield spikes is a useful framework whether or not you ever touch TLT.
For educational purposes only. Not investment advice. Always do your own research.
👉 This is a thought experiment, not a recommendation. Studying how bond ETFs move during rate cycles is one of the most useful things a retail trader can do right now.
The Boring Strategy That Actually Fits This Market
How it works
When yields are high and stocks are shaky, some traders shift toward a covered call strategy on SPY. You already own the shares. You sell someone else the right to buy them at a higher price. They pay you a premium. You collect cash while you wait.

The trade-off is real: if SPY rockets past your strike price, you miss out on those gains above it. But in a choppy, yield-pressured market where big upside feels less likely, giving up some ceiling in exchange for steady income is a structure worth understanding.
Strategy: Covered Call Wheel on SPY Category: INCOME / OPTIONS The covered call wheel involves selling call options against existing SPY shares on a rolling monthly basis, collecting premium income. When the market moves sideways or slightly down (which rising-yield environments often produce), the premium provides a buffer against small price drops. The trade-off is a capped upside: a sudden SPY rally above your strike means you sell your shares at the strike price and miss the extra gain. This strategy rewards patience more than it rewards timing. Browse on the BotSpot Marketplace Build it on BotSpot Educational only. Backtest the strategy yourself on BotSpot to draw your own conclusions.
👉 Don't take our word for it. Run the backtest yourself with BotSpot's AI and see how this structure behaves across different rate environments.
How Scared Is Everyone Right Now?
 Mood: Neutral (VIX 16.1)
VIX at 16.1 means the market is nervous but not screaming. Think of it as the friend who is clearly stressed but still smiling at dinner. Yields are spiking, stocks are sliding, and yet the fear gauge is shrugging. Make it make sense.
Mood: Neutral (VIX 16.1)
VIX at 16.1 means the market is nervous but not screaming. Think of it as the friend who is clearly stressed but still smiling at dinner. Yields are spiking, stocks are sliding, and yet the fear gauge is shrugging. Make it make sense.
The Bond Market Right Now
The Week in Crumbs
- Yields hit 5.1% on the 10-year. Last time this happened, people were arguing about whether to get a Motorola RAZR or a BlackBerry.
- Stocks fell on the news. Turns out investors prefer not competing with 5% government bond yields. Rude.
- A former Dallas Fed chief says calm down. The bond market is overpricing hikes, he says. The bond market has not responded to his voicemails.
- Gold had a rough week. High yields make gold less appealing because gold pays you nothing. Math is cold like that.
- Household net worth hit $181.6 trillion. Stocks up $5.5 trillion, real estate down a bit. Your 401(k) is working harder than your house.
- Oil kept climbing too. Oil plus rising yields plus a hawkish Fed is the kind of trio nobody wanted on the same playlist.
- The dollar strengthened again. Every other currency looked at the dollar this week and said fine, you win, while slowly backing away.
The BotSpot Team
Issue 22 · Sep 24, 2026